Problem setting
In this problem, we have a dataset of positive-labeled samples:
") , and an unlabeled dataset drawn from the input distribution
, and an unlabeled dataset drawn from the input distribution ") . This is illustrated below:
. This is illustrated below:
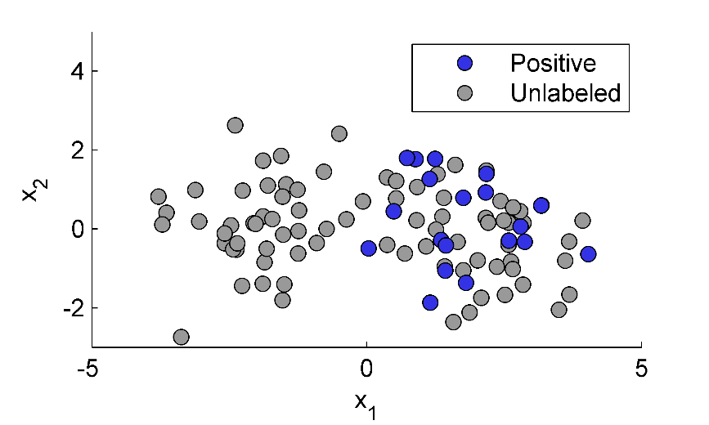
The goal is to estimate the unknown class prior ") .
.
This problem is of great importance, since the class-prior is used in methods to train a classifier from positive and unlabeled data.
Software implementation
MATLAB implementation of the direct PE method: PEPriorEst.m
Additional experimental results
More results, not in the letter, for several benchmark datasets is given in this section. This is followed by a numerical illustration showing the effect of highly overlapping class-conditional densities.
Benchmark datasets
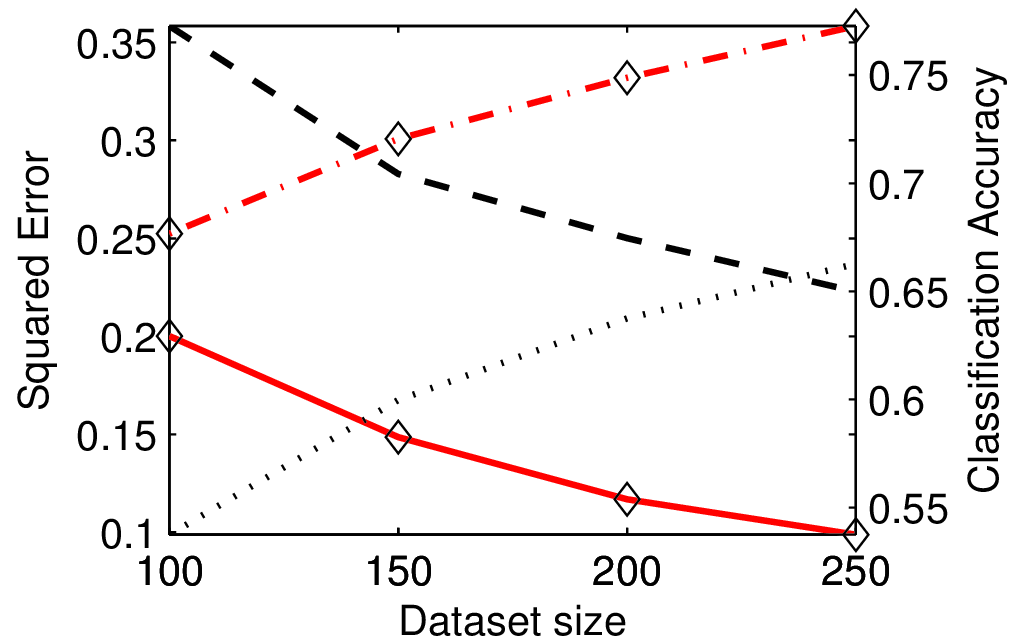
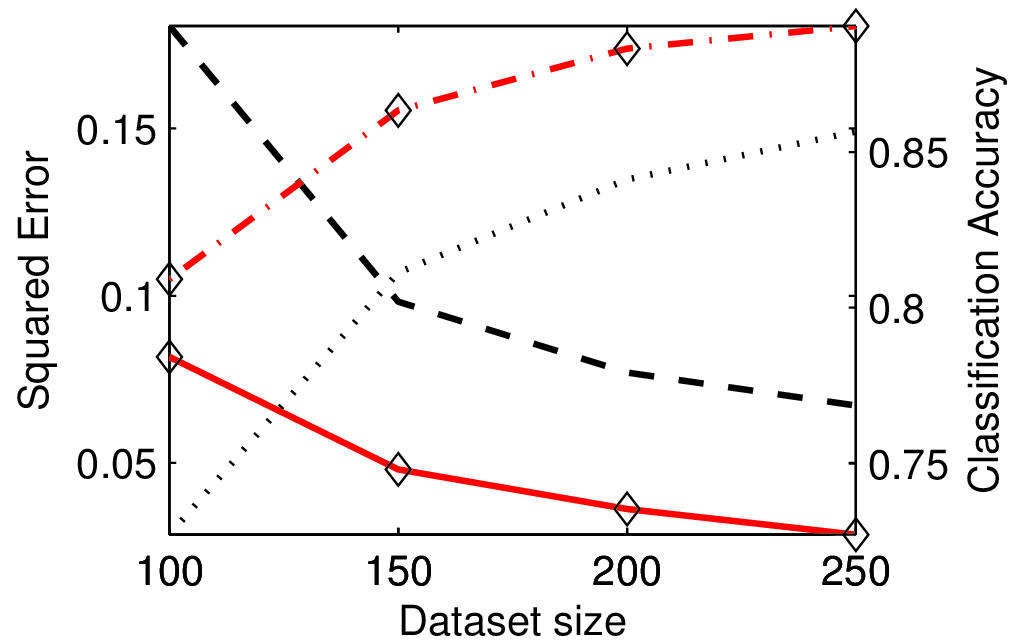
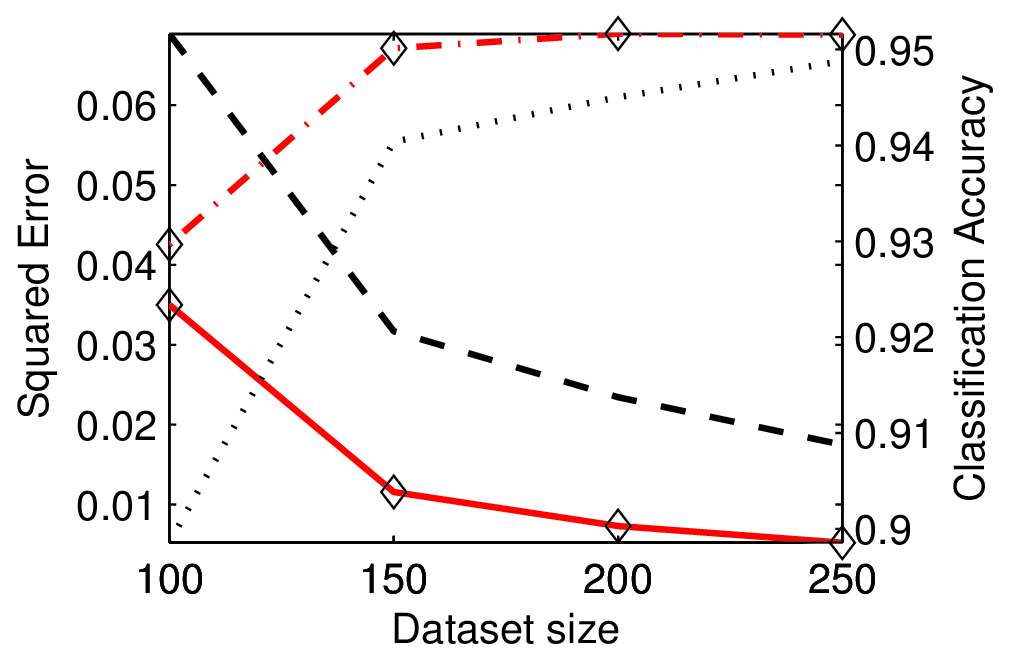
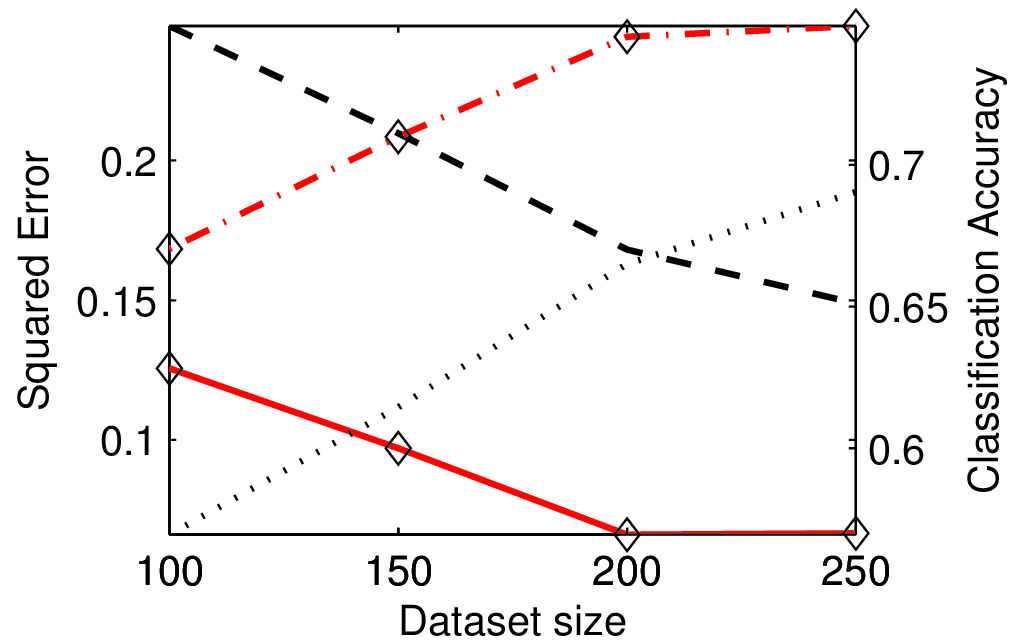
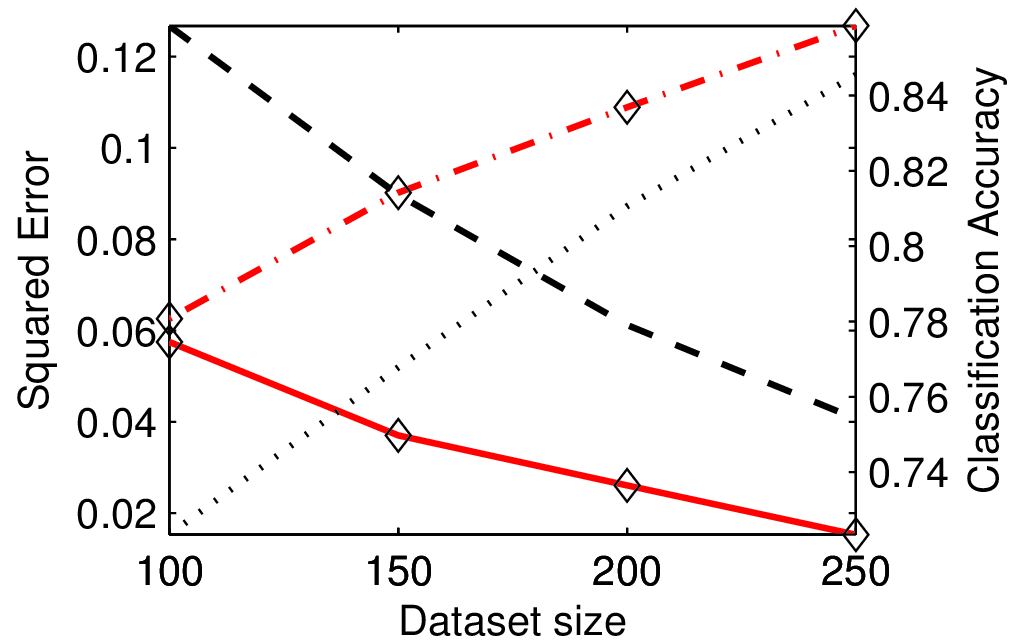
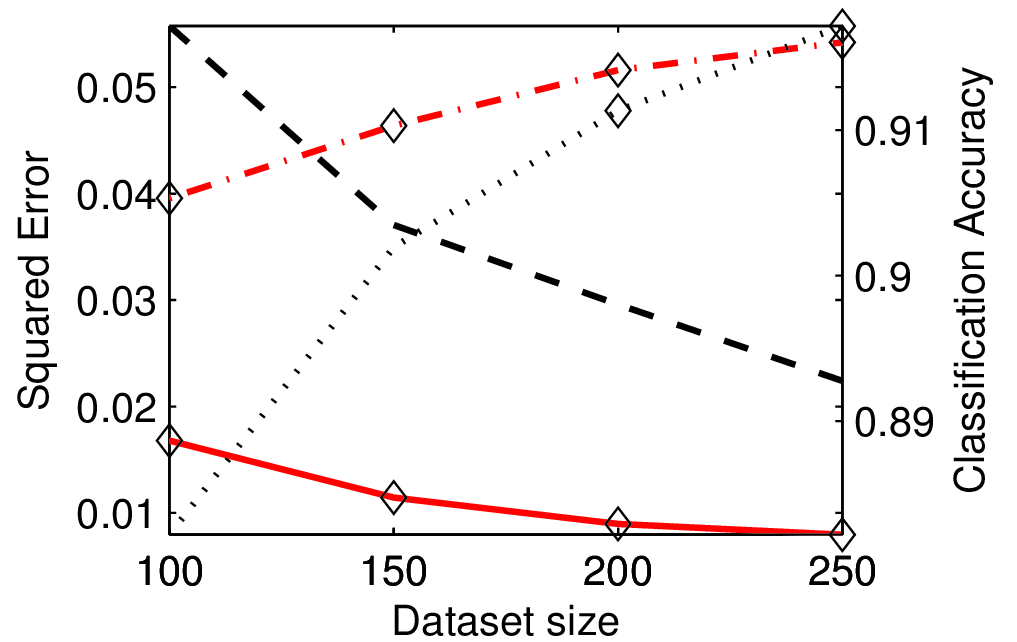
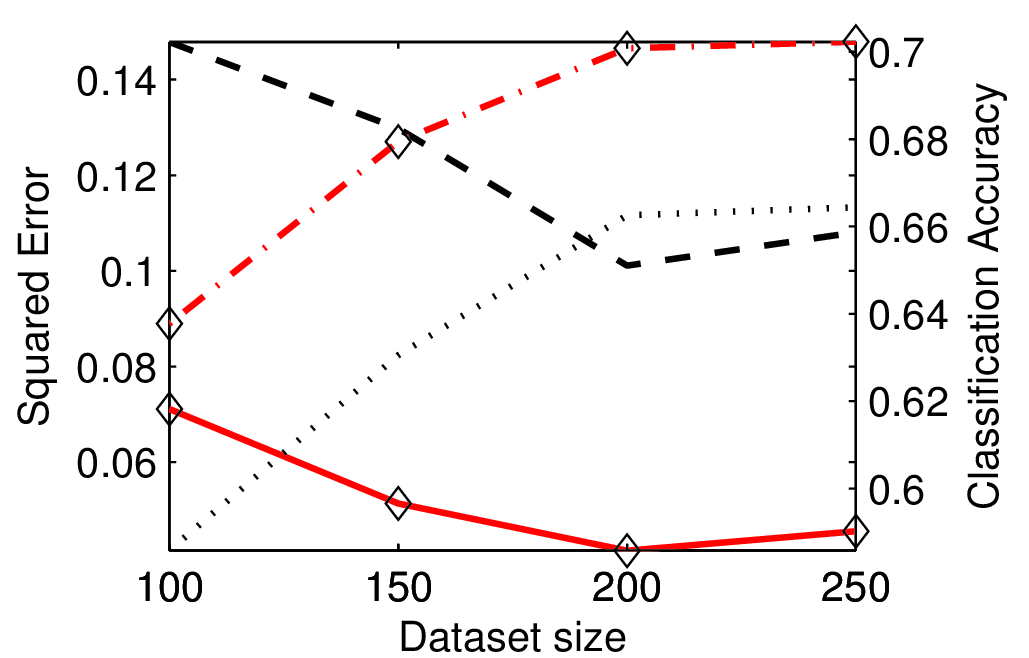
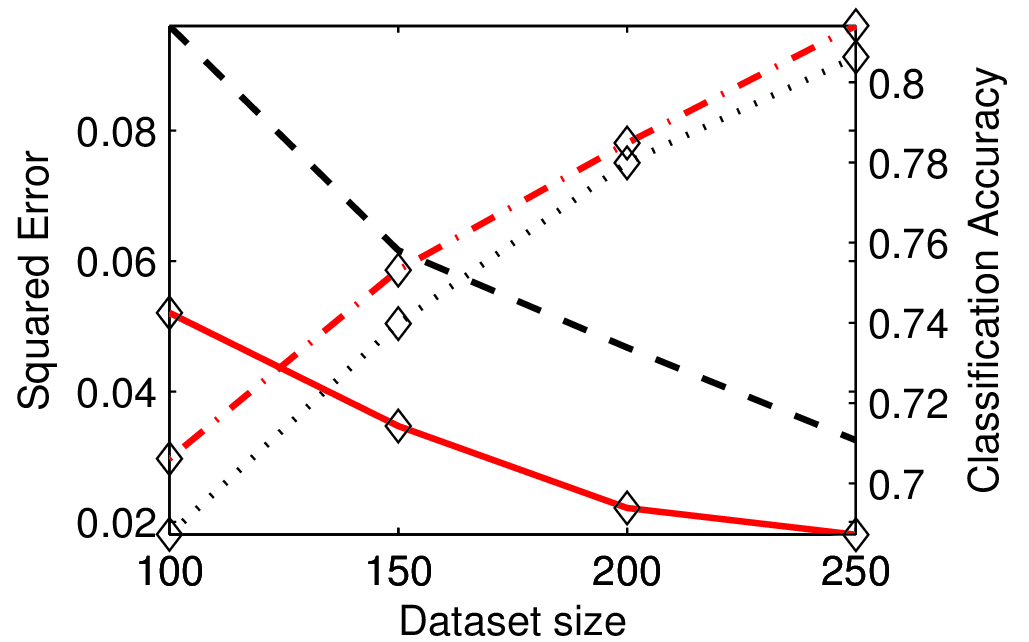
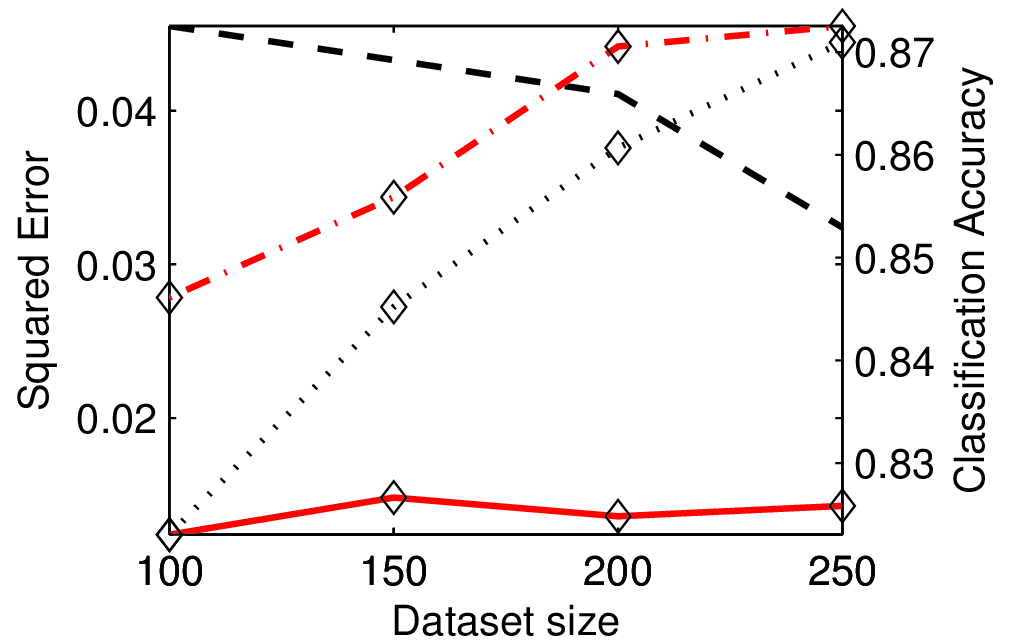
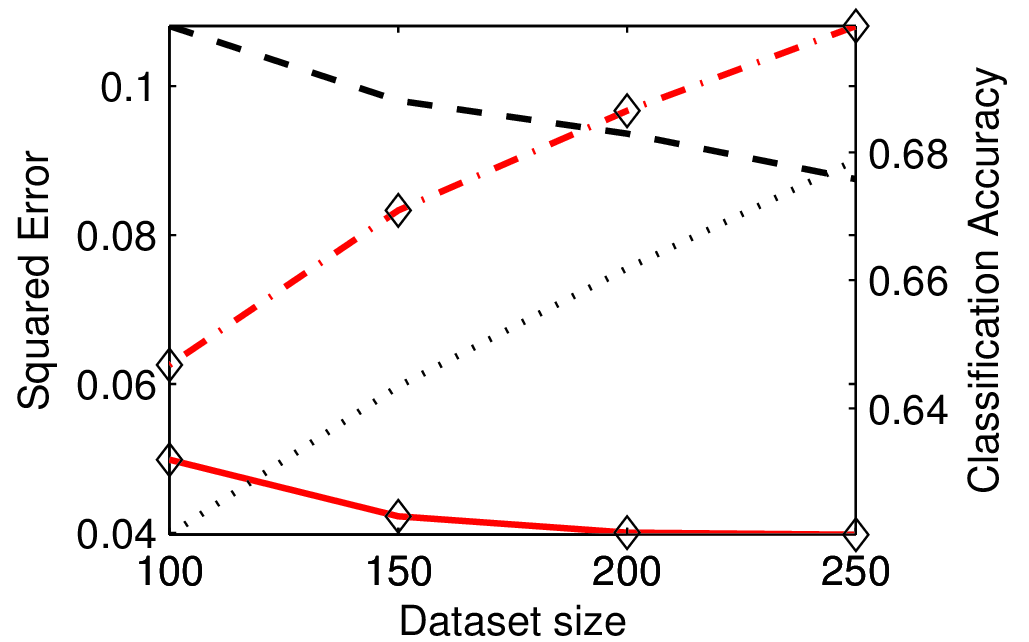
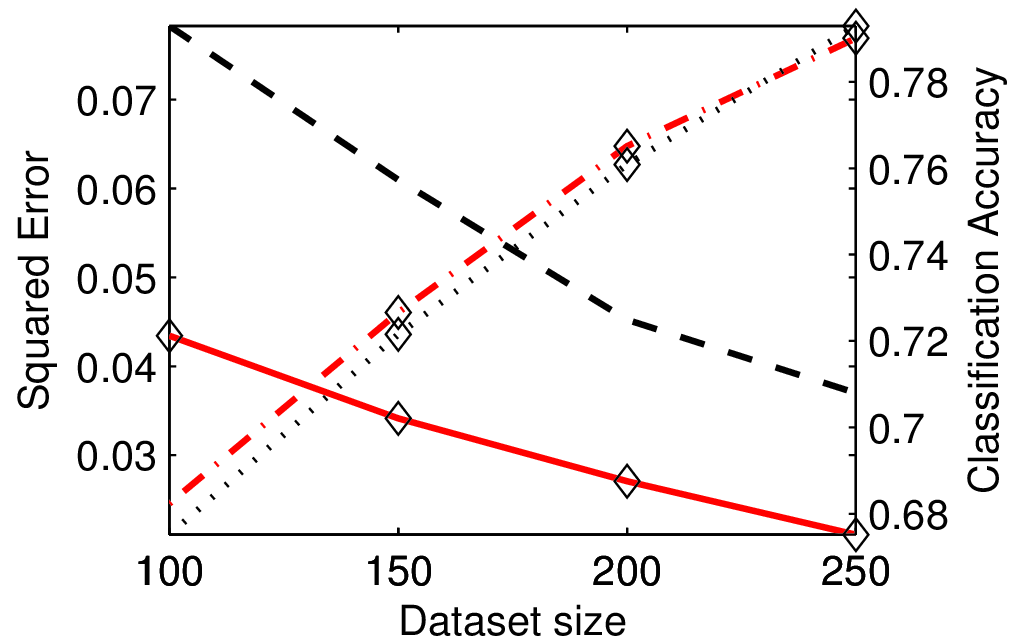
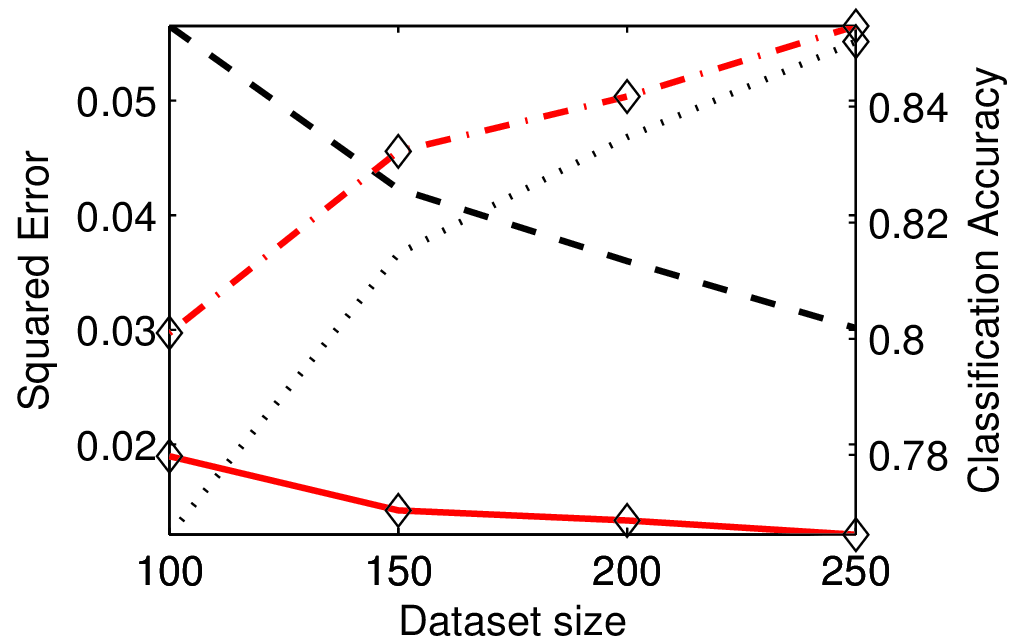
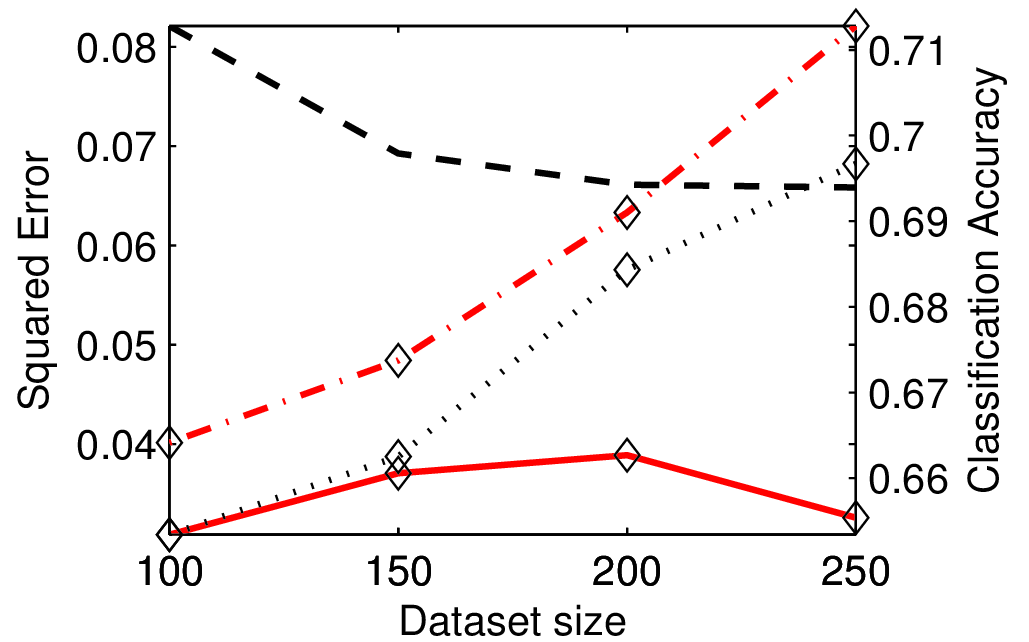
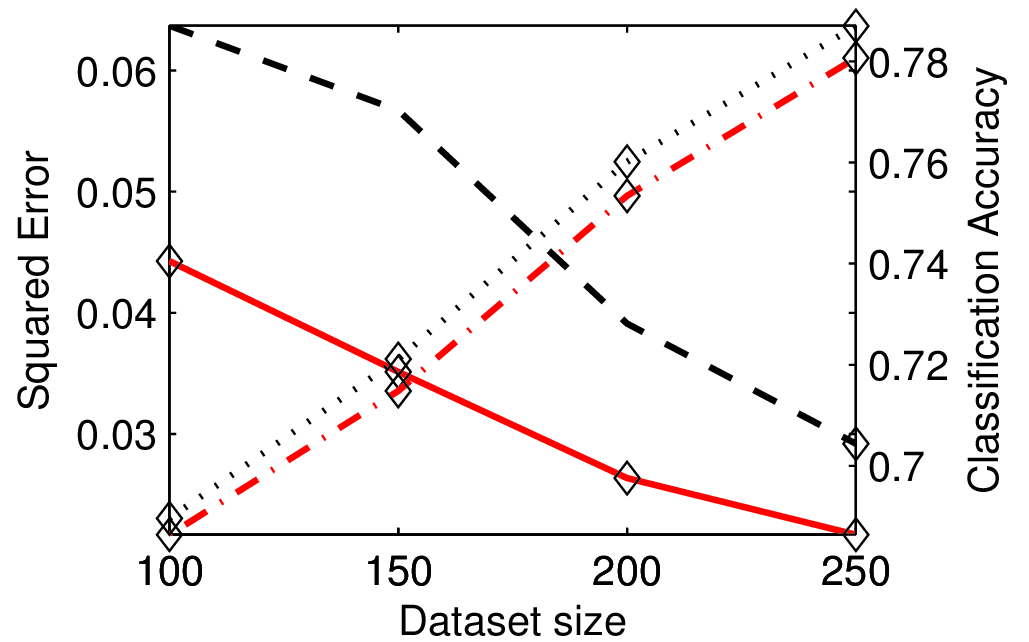
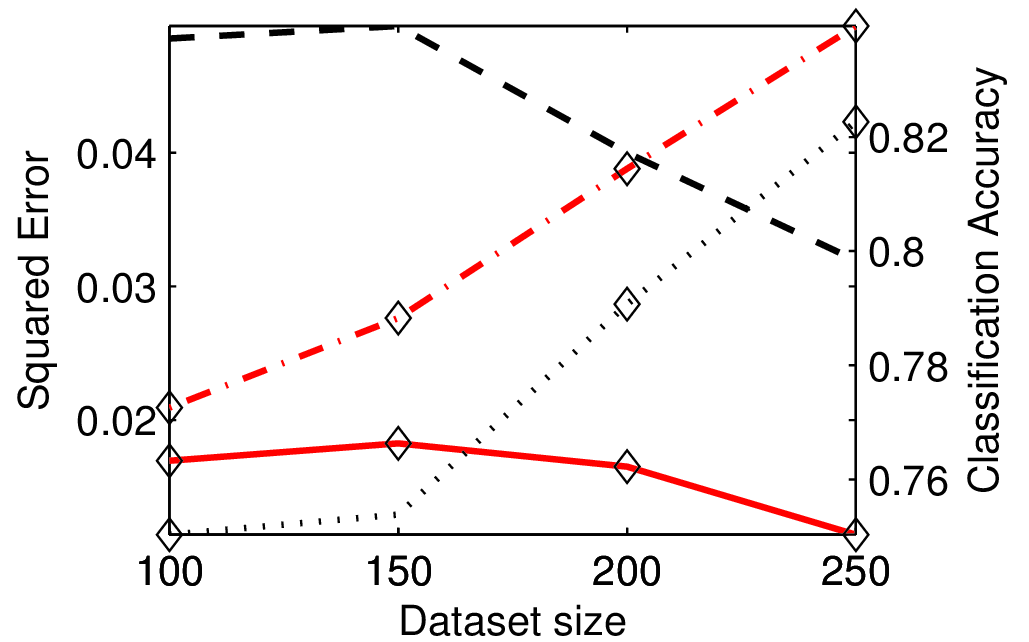
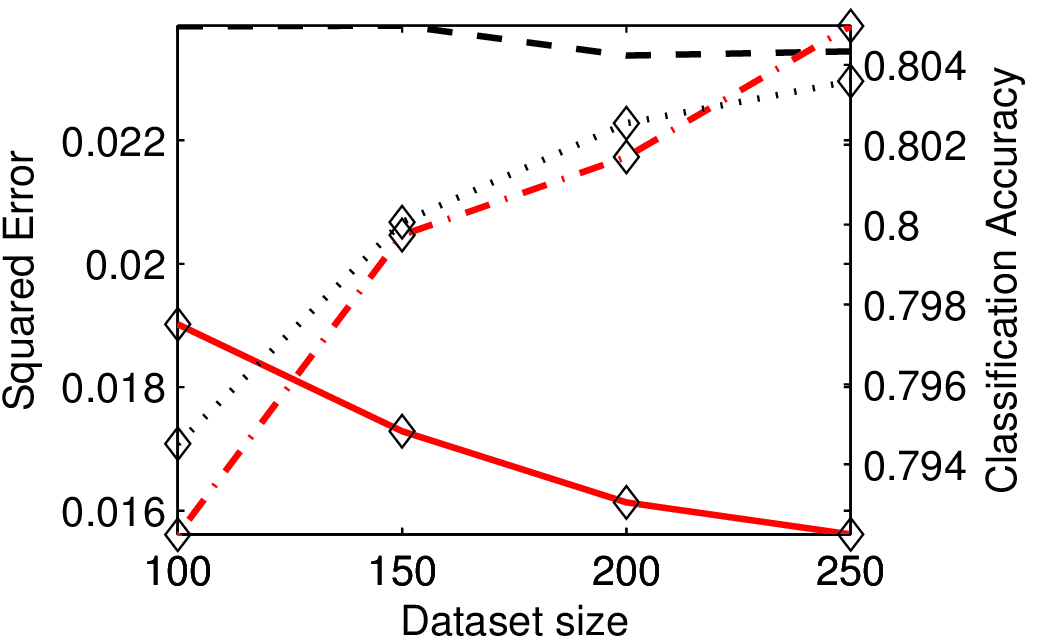
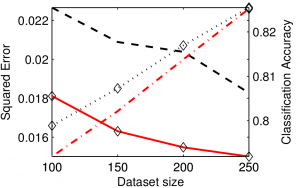
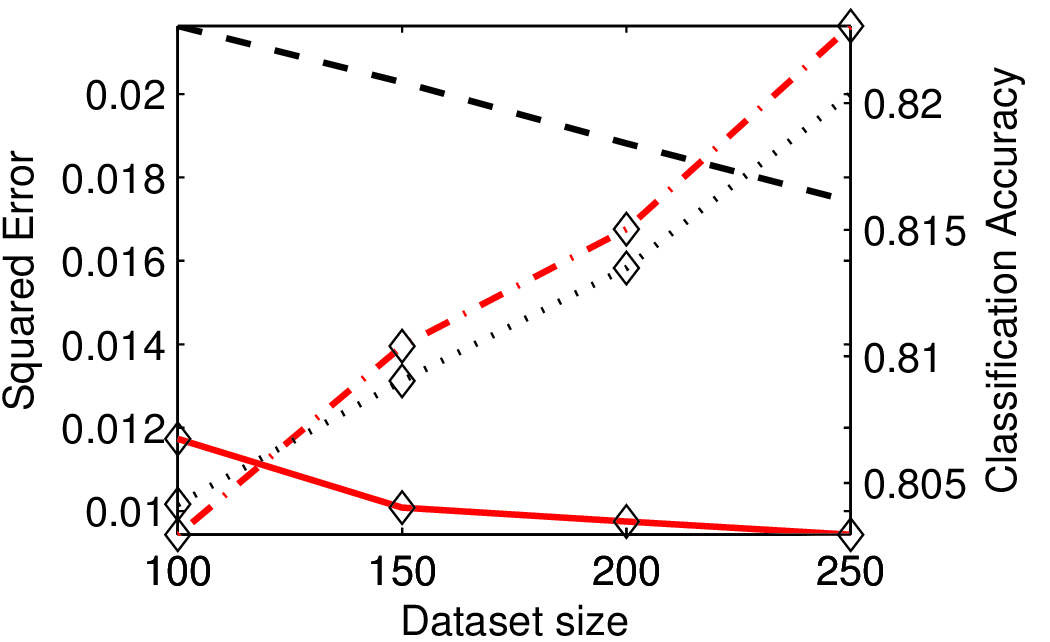
Additional results for a wider range of class priors (and more datasets are given below). ‘PE’ (solid red) and ‘PE(CA)’ (dashed red) indicates the squared error and classification accuracy for class prior estimation via direct PE divergence estimation. ‘EN’ (black dashed) and ‘EN(CA)’ (black dotted) indicates the squared error and classification accuracy for class prior estimation using the method of Elkan and Noto (ACM SIGKDD, 2008).
| Class-Prior | Australian | Diabetes | Image | Waveform |
| 0.1 | 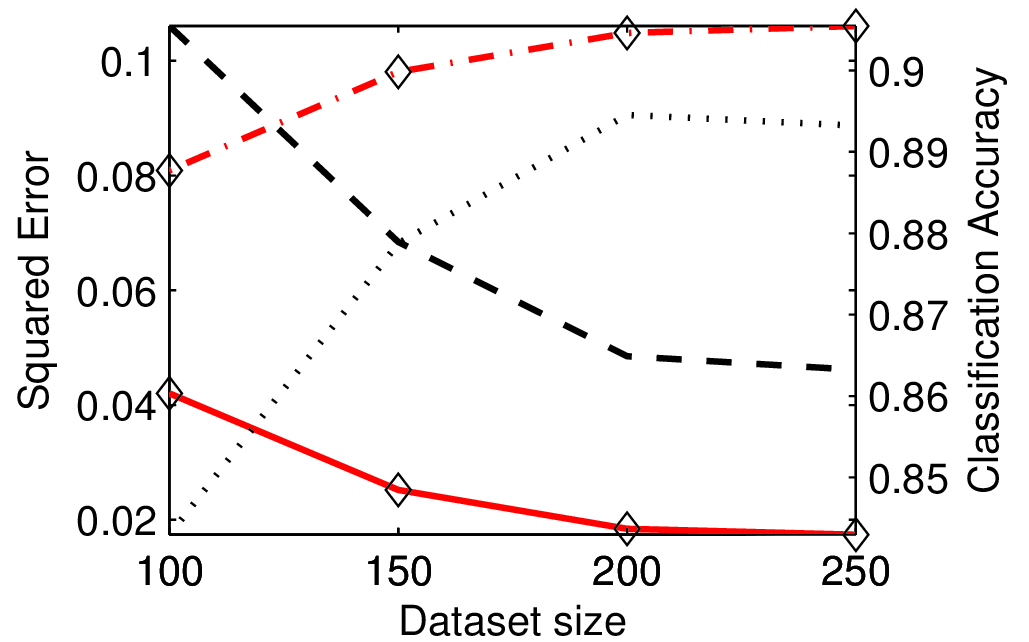 |
 |
 |
 |
| 0.2 | 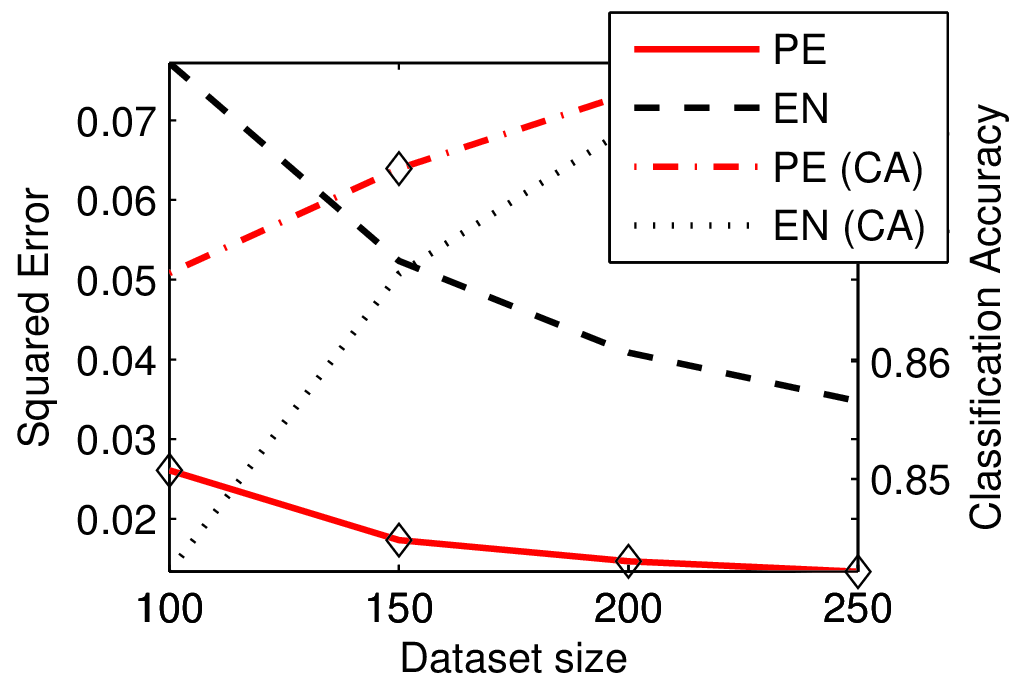 |
 |
 |
 |
| 0.4 | 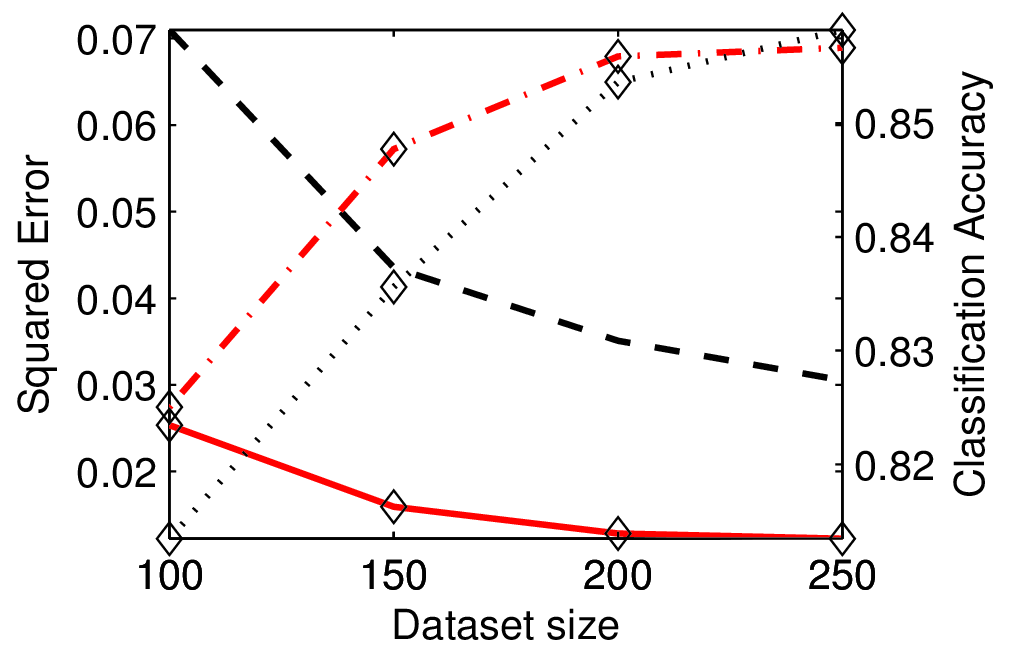 |
 |
 |
 |
| 0.5 | 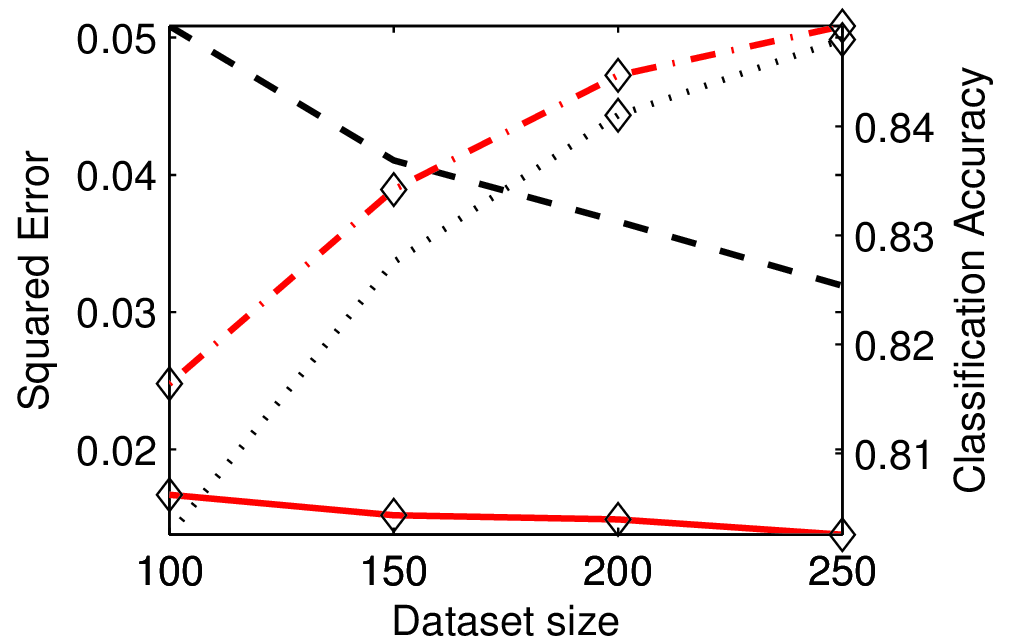 |
 |
 |
 |
| 0.6 | 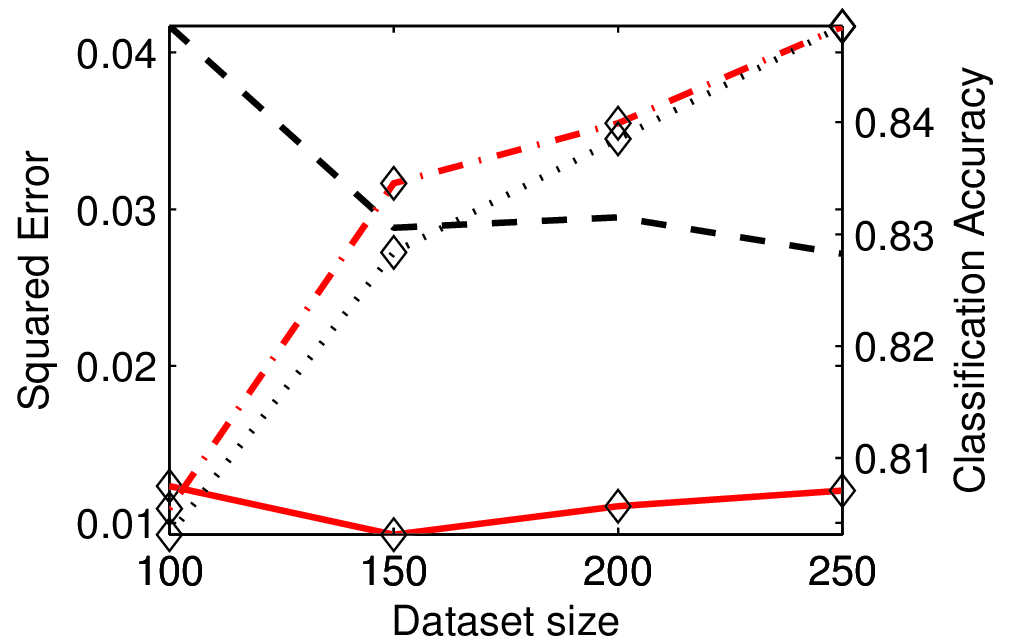 |
 |
 |
 |
| 0.8 | 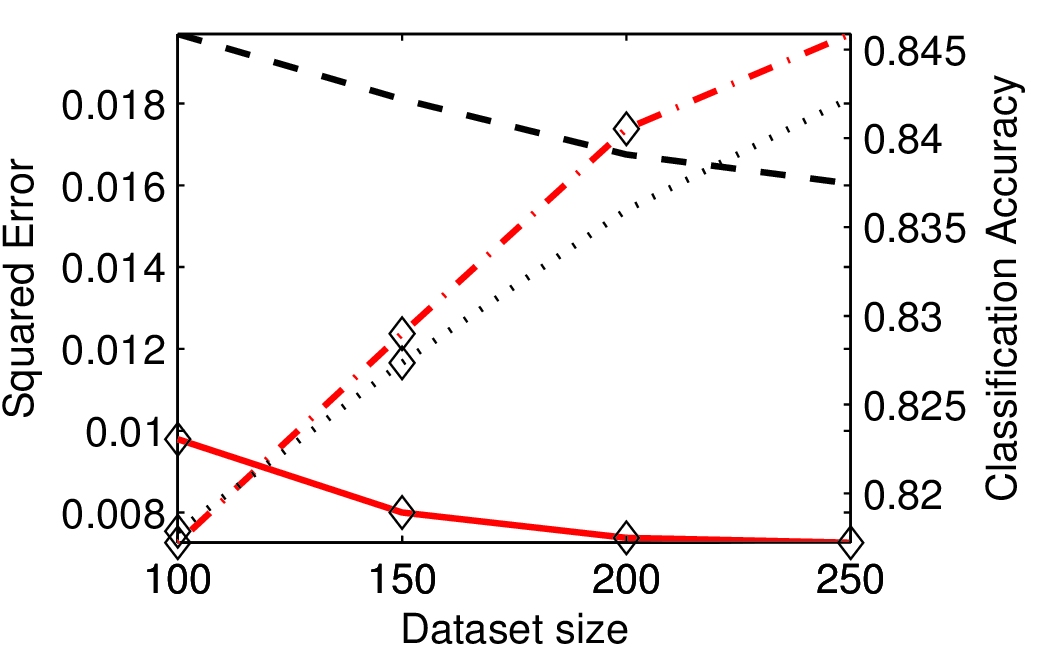 |
 |
 |
 |
Numerical Illustration: Overlapping class-conditional densities
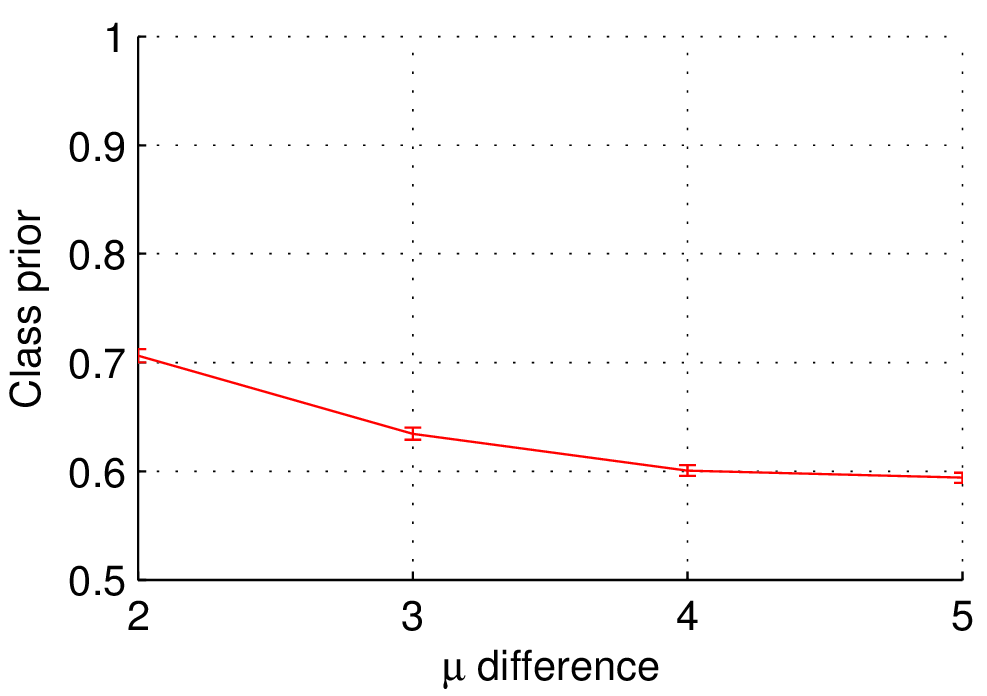
In this toy example, the class-conditional densities were highly overlapping Gaussians. Both Gaussians were univariate but had different means. samples were used to estimate the class prior using the PE method. Positive labels were labeled with a probability
 = 0.5") .The difference between means is indicated on the x-axis and the class prior estimates are indicated on the y-axis. The true class prior was
.The difference between means is indicated on the x-axis and the class prior estimates are indicated on the y-axis. The true class prior was  .
.
References
- du Plessis, M. C. & Sugiyama, M.
Class prior estimation from positive and unlabeled data.
IEICE Transactions on Information and Systems, vol.E97-D, no.5, pp.1358-1362, 2014.
[Paper]